How We KnowAnswer
Why Can We Read Mammoth DNA but Not Dinosaur DNA?
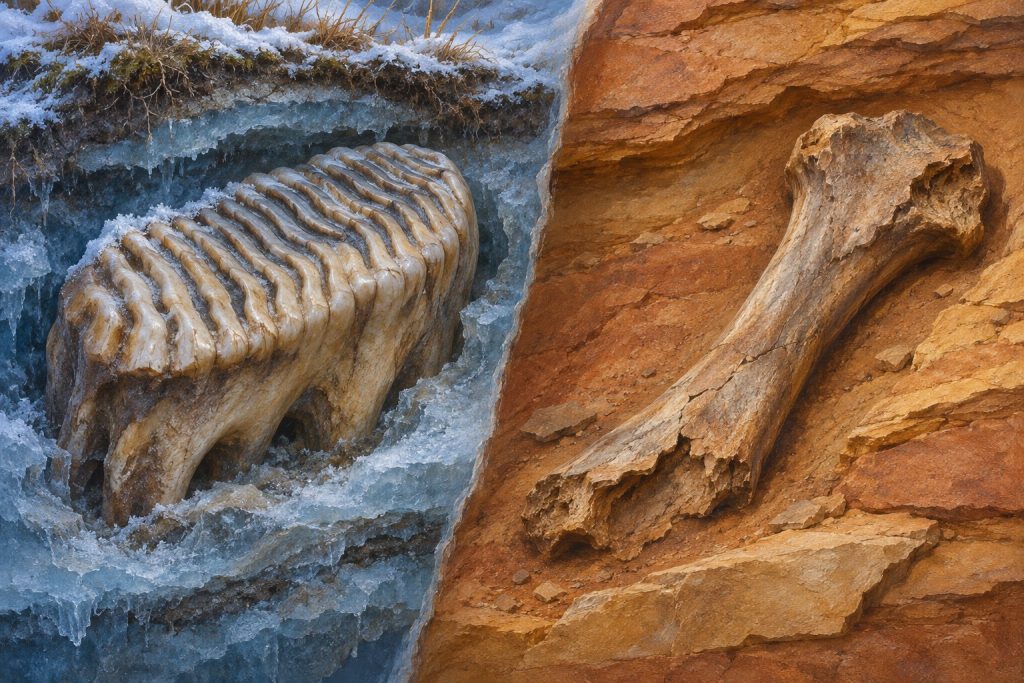
A frozen mammoth tooth can hold readable DNA. A dinosaur fossil can preserve the shape of a bone for far longer. Here’s why those are different feats.
THE QUESTION LIBRARY HOW WE KNOW
A few concrete questions help you judge a striking number without dismissing useful evidence.
You can often spot a misleading claim by checking what was counted, the comparison, the chart scale and the uncertainty. Follow the number to its original source. A large percentage change can begin from a small amount. A graph can exaggerate proportions. Statistically significant does not mean large or important, and it does not settle a conclusion. These checks help you judge what the evidence supports.
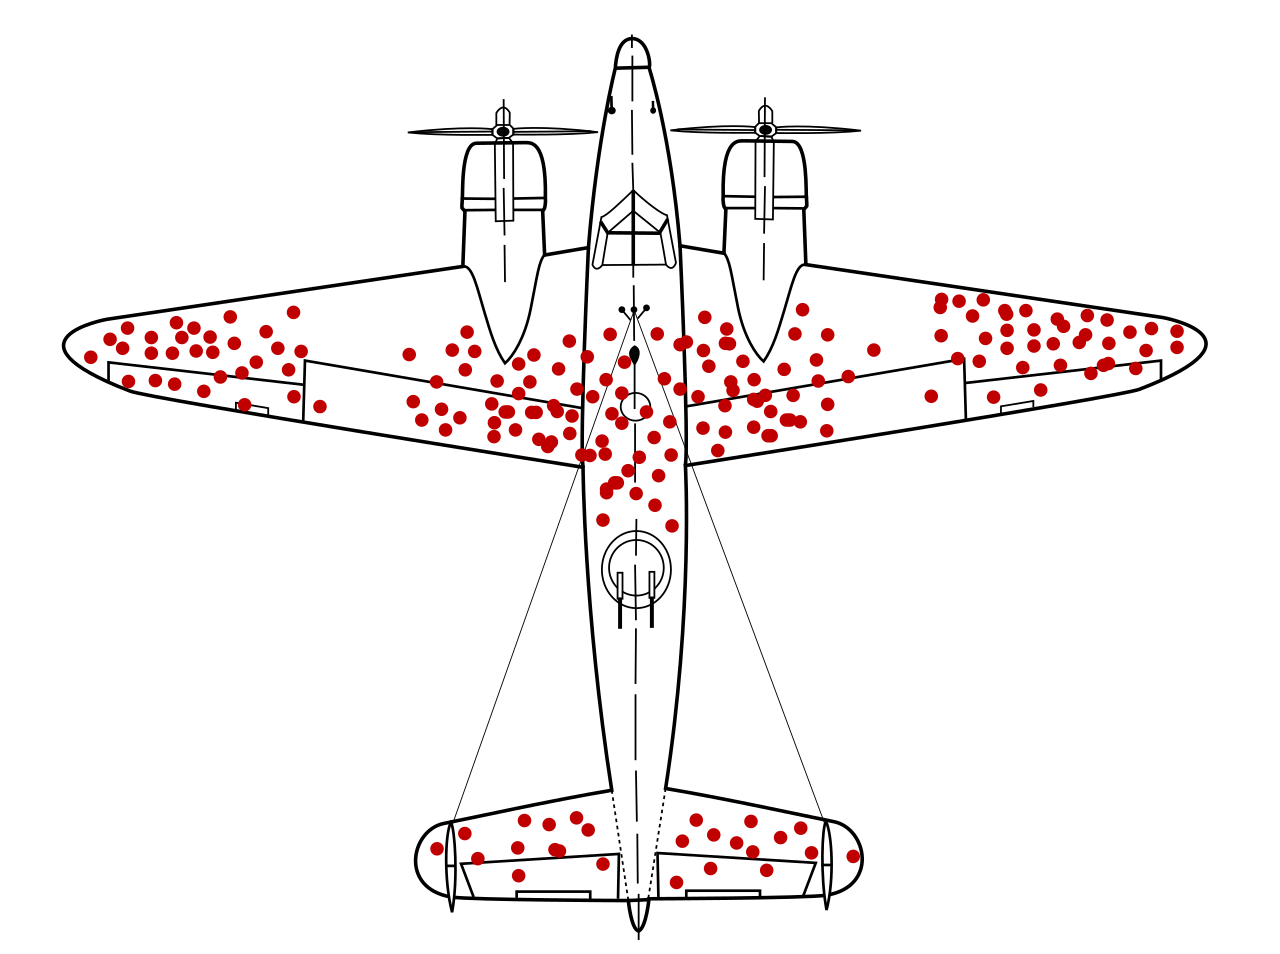
An illustration of hits recorded on aircraft that returned. A chart needs to make clear which observations were counted and which are missing; this drawing is not a complete aircraft damage survey.
WHERE THE EVIDENCE STANDS
WHAT WE DON’T KNOW YET
An incomplete headline cannot tell us how the data were collected or which explanations were tested. A checklist may reveal missing information without settling the quality of a complex analysis.
WHAT WOULD CHANGE THIS ANSWER
Original data, clear counting rules and appropriate uncertainty can change our assessment of a particular story. Independent analysis may show that a numerical comparison was correct, incomplete or mistaken.
You can often spot a misleading number by asking what was counted, what it was compared with and what the report leaves out. You do not need to distrust every statistic. You need enough context to understand what the number can support.
Consider a made-up example. A school loses two library books out of every hundred loans one month and four out of every hundred the next. A headline could call that a 100% increase. The arithmetic is correct: four is twice two. It is also an increase of two books per hundred loans, or two percentage points. Both descriptions belong in the picture. Neither tells us why the change happened.
A graph adds another choice. How much of the vertical scale does it show? Are its labels clear? Does it compare the same kind of measurement over the same time span? The UK Government Analysis Function's chart guidance explains why a shortened scale can distort the proportions of bars. A line chart may reasonably focus on a narrow range, provided the scale is clear.
Some headlines add the words statistically significant. That phrase describes a calculation under assumptions. It does not mean the finding is large, important or beyond question. The American Statistical Association warns against using a single numerical threshold as a verdict.
A useful first response is to follow the number back to its source. Look for the original table, the measured group and the uncertainty around the estimate. Separate what the data show from the explanation offered for them. If that information is missing, you have found a reason to pause. You have not yet found evidence that the number was made up.
THE LONG ANSWER · ABOUT 5 MINUTES
The short answer, how sure we are, what we don’t know, what would change our mind and every source stay free on every page, for everyone.
All Access members read the long answer: the evidence piece by piece, the strongest objections, and how to check it yourself.
Join All Access · $1 a week Or $6 a month
Billed $52 once a year. Cancel anytime in your account.
Until December 4, 11:59 pm Pacific: the Founding rate is $39 a year, and it stays $39 while you stay a member.
Create a free account: 6 long answers a month, email only.
Paying never buys a different answer. Our Paywall Promise
What makes a source trustworthy?
Good science makes a clear, testable claim; shows how evidence was gathered and analyzed; reports uncertainty; and lets others check the work.
God Plays Dice answers big questions in plain words, with sources and one of six honest labels.
See a mistake? Report a problem. Corrections are made openly.
CONTINUE THE THREAD
How We KnowAnswer
A frozen mammoth tooth can hold readable DNA. A dinosaur fossil can preserve the shape of a bone for far longer. Here’s why those are different feats.
How We KnowAnswer
If 100 bacteria carry the same DNA change, did it arise once or many times? The answer matters when testing Ricardo Maldonado’s hypothesis.
How We KnowAnswer
A space image can be faithful to measured light without matching human eyesight. Here is how to read the translation.
The Architect AI companion · All Access
Labels describe the evidence for a claim, not the people who hold it.
Match my phone uses your device’s light or dark setting.